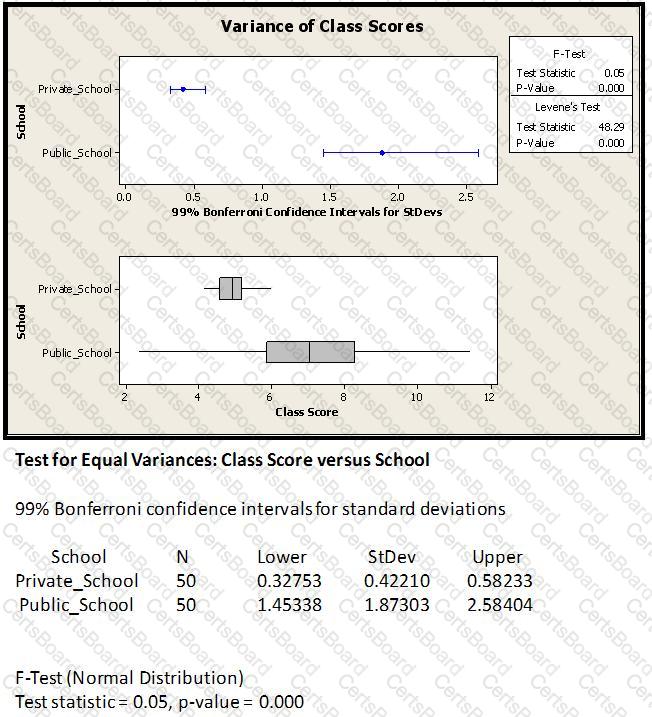
From the variance F-test shown above, which of these conclusions is/are valid?

Control Charts were developed by Dr. Shewhart to track data over time. To detect Special Cause variation the Control Charts use which of these?
How many experimental runs exist in a Full Factorial and fully randomized design for 4 factors with 2 replicates for the Corner Points and no Center Points? The factors in the experiment are only at 2-levels.
If you can Poka-Yoke a defect out of the process entirely then you do not need use SPC on the characteristic of interest in the defect.


