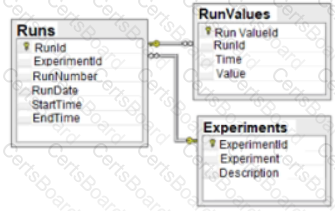
Given the diagram below:
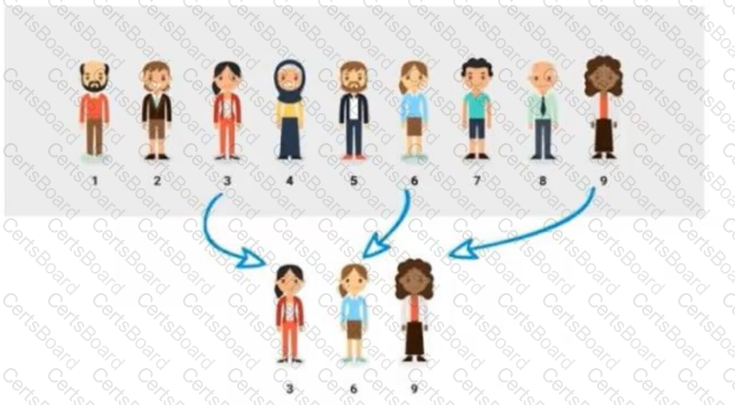
Which of the following types of sampling is depicted in the image?
Which of the following would be considered non-personally identifiable information?
A reporting analyst is creating a dashboard that shows the year-over-year performance for a sales organization. Which of the following is the best visual for the analyst use to illustrate the organization's performance?
A client wants a new report that will be automatically emailed to all global sales teams on a weekly basis. Each sales team must be able to view the sales for its region and the combined sales for all regions. Which of the following would be the most efficient method for meeting the requirements?
Which of the following is a process that is used during data integration to collect, blend, and load data?
A data analyst is compiling a report that a Chief Executive Officer needs for an impromptu meeting. The report should include information on the previous day's performance. Which of the following reports should the analyst provide?
Which of the following defines the policies and procedures for managing the master data?


TESTED 02 Apr 2025