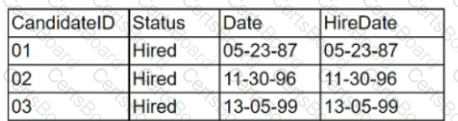
Given the table below:

Which of the following boxes indicates that a Type Il error has occurred?
Which of the following is the best reason to use database views instead of tables?
Given the following data table:
Which of the following are appropriate reasons to undertake data cleansing? (Select two).
Which one of the following programming languages is specifically designed for use in analytics applications?
A marketing analytics team received customer transaction data from two different sources. The data is complete and accurate; however, the field names appear to be inconsistent. Given the following tables:
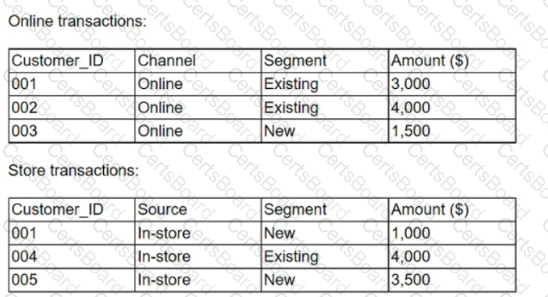
Which of the following is considered best practice if the team wants to consolidate the files and conduct further analysis?
A business unit made the following modification to the values in a table:
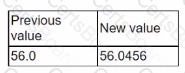
Which of the following data quality dimensions was applied in this scenario?
A data analyst needs to present the results of an online marketing campaign to the marketing manager. The manager wants to see the most important KPIs and measure the return on marketing investment. Which of the following should the data analyst use to BEST communicate this information to the manager?
Which of the following is the best approach to use to gain a general understanding of a data set?
What category of data stewardship work is focused on ensuring that the organization respects the wishes of data subjects?


TESTED 02 Apr 2025