Weekend Special 70% Discount Offer - Ends in 0d 00h 00m 00s - Coupon code: Board70

PL-300 Exam Dumps - Microsoft Certified: Power BI Data Analyst Associate Questions and Answers

Question # 34

You need to create the On-Time Shipping report. The report must include a visualization that shows the percentage of late orders.

Which type of visualization should you create?

Options:

A.

bar chart

B.

scatterplot

C.

pie chart

Buy Now
Question # 35

You need to ensure that the data is updated to meet the report requirements. The solution must minimize configuration effort.

What should you do?

Options:

A.

From each report in powerbi.com. select Refresh visuals

B.

From Power Bl Desktop, download the PBIX file and refresh the data.

C.

Configure a scheduled refresh without using an on-premises data gateway.

D.

Configure a scheduled refresh by using an on-premises data gateway

Buy Now
Question # 36

Which two types of visualizations can be used in the balance sheet reports to meet the reporting goals? Each correct answer presents part of the solution.

NOTE: Each correct selection is worth one point.

Options:

A.

a line chart that shows balances by quarter filtered to account categories that are long-term liabilities.

B.

a clustered column chart that shows balances by date (x-axis) and account category (legend) without

filters.

C.

a clustered column chart that shows balances by quarter filtered to account categories that are long-term liabilities.

D.

a pie chart that shows balances by account category without filters.

E.

a ribbon chart that shows balances by quarter and accounts in the legend.

Buy Now
Question # 37

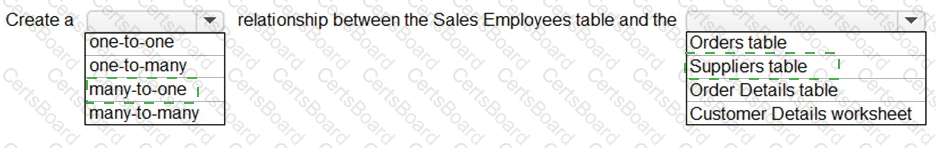
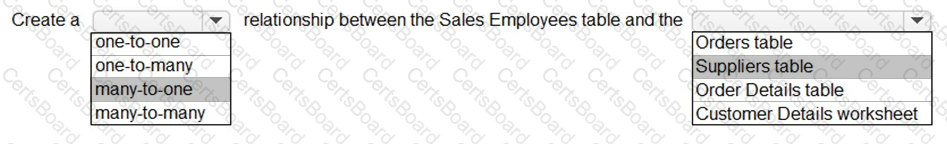
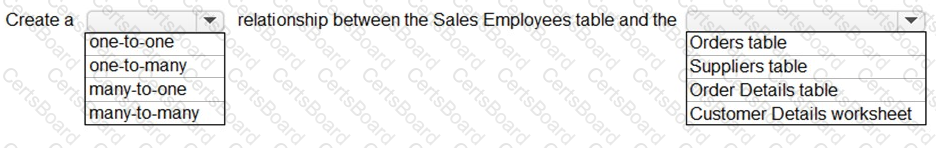
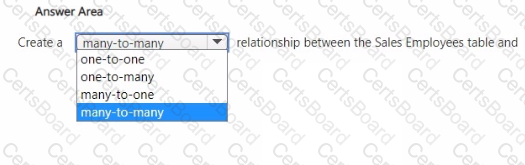
You need to create a relationship in the dataset for RLS.

What should you do? To answer, select the appropriate options in the answer area.

NOTE: Each correct selection is worth one point.

Options:

Buy Now
Question # 38

You need to design the data model to meet the report requirements.

What should you do in Power BI Desktop?

Options:

A.

From Power Query, use a DAX expression to add columns to the Orders table to calculate the calendar quarter of the OrderDate column, the calendar month of the OrderDate column, the calendar quarter of the ShippedDate column, and the calendar month of the ShippedDate column.

B.

From Power Query, add columns to the Orders table to calculate the calendar quarter and the calendar month of the OrderDate column.

C.

From Power Bl Desktop, use the Auto date/time option when creating the reports.

D.

From Power Query, add a date table. Create an active relationship to the OrderDate column in the Orders table and an inactive relationship to the ShippedDate column in the Orders table.

Buy Now
Question # 39

You need to create a relationship in the data model for RLS.

What should you do? To answer, select the appropriate options in the answer area.

NOTE: Each correct selection is worth one point.

Options:

Buy Now
Question # 40

You need to minimize the size of the semantic model. The solution must meet the report requirements.

What should you do?

Options:

A.

Filter out discontinued products while importing the Products table.

B.

Group the Categories table by the CategorylD column.

C.

Change the OrderlD column in the Orders table to the Text data type.

D.

Remove the QuantityPerUnit column from the Products table.

Buy Now
Question # 41

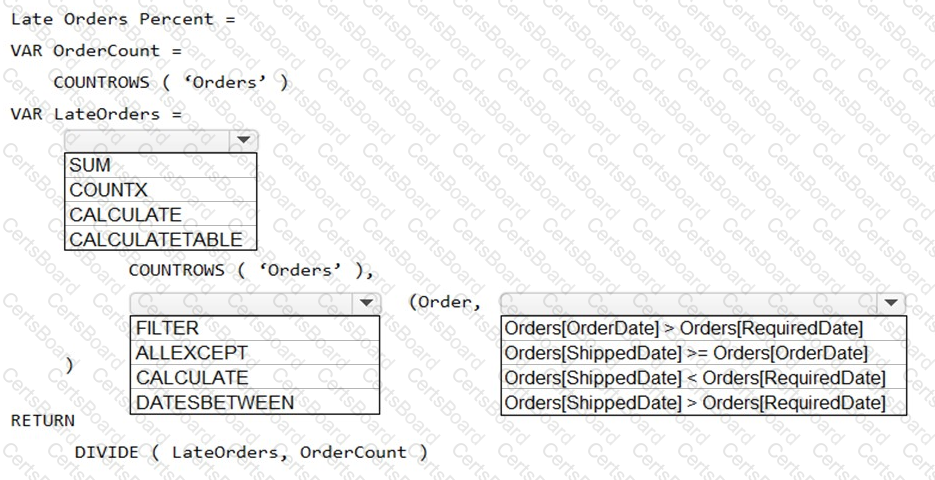
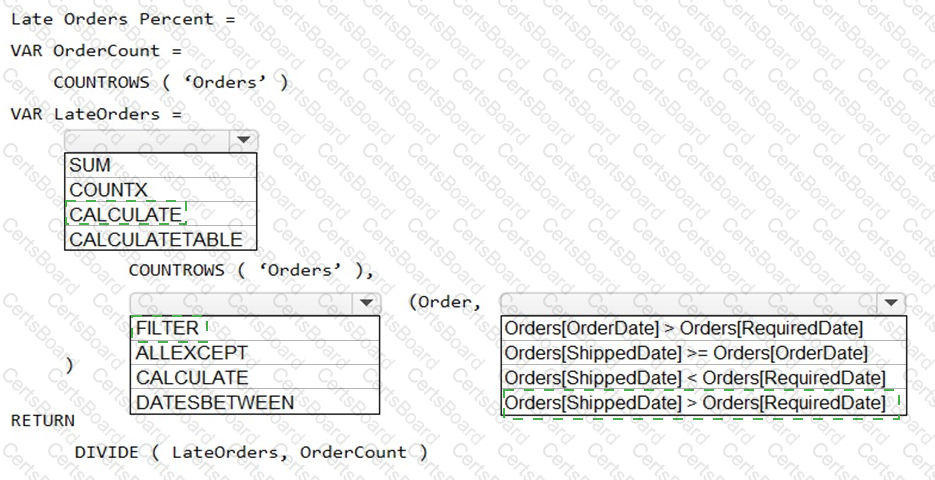
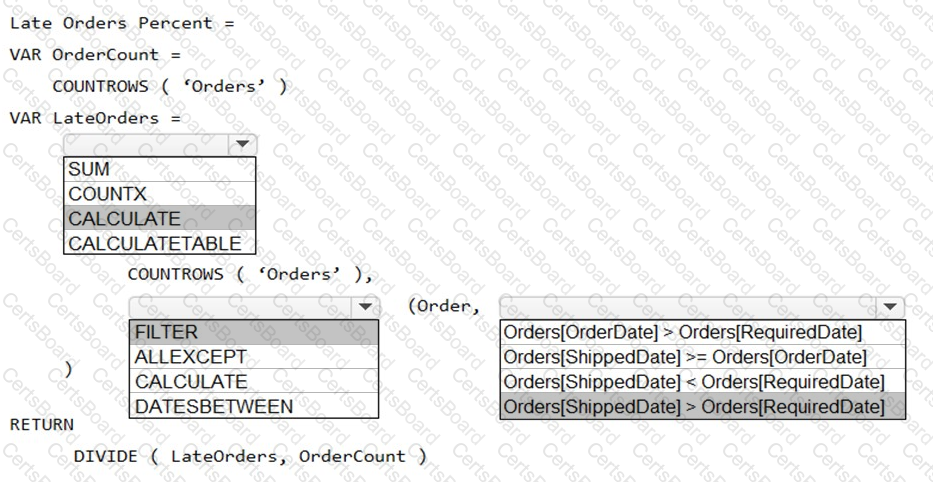
You need to create a measure that will return the percentage of late orders.

How should you complete the DAX expression? To answer, select the appropriate options in the answer area.

NOTE: Each correct selection is worth one point.

Options:

Buy Now