You have a Power Bl report that contains five pages.
Pages 1 to 4 are visible and page 5 is hidden.
You need to create a solution that will enable users to quickly navigate from the first page to all the other visible pages. The solution must minimize development and maintenance effort as pages are added to the report.
What should you do first?
Note: This question is part of a series of questions that present the same scenario. Each question in the series contains a unique solution that might meet the stated goals. Some question sets might have more than one correct solution, while others might not have a correct solution.
After you answer a question in this section, you will NOT be able to return to it. As a result, these questions will not appear in the review screen.
You have five reports and two dashboards in a workspace.
You need to grant all organizational users read access to one dashboard and three reports
Solution: In Microsoft Azure Active Directory (Azure AD), part of Microsoft Entra. you create a group that contains all the users. You share each selected report and the one dashboard to the group.
Does this meet the goal?
You have a Power BI workspace that contains a single report named Sales.
You need to add all the visuals from Sales to a dashboard. The solution must ensure that additional visual added to the page area added automatically to the dashboard.
Which three actions should you perform in sequence? To answer, move the appropriate actions from the list of actions to the answer area and arrange them in the correct order.

From Power Query Editor, you attempt to execute a query and receive the following error message.
Datasource.Error: could not find file.
What are two possible causes of the error? Each correct answer presents a complete solution.
NOTE: Each correct selection is worth one point.
You create a Power Bl report1 named Summary1 You discover that Summary1 is slow.
You run Performance analyzer to identify performance metrics for Summary1
Which two metrics display the execution duration in Performance analyzer* Each correct answer present part of the solution. NOTE: Each correct answer is worth one point.
Note: This question is part of a series of questions that present the same scenario. Each question in the series contains a unique solution that might meet the stated goals. Some question sets might have more than one correct solution, while others might not have a correct solution.
After you answer a question in this section, you will NOT be able to return to it. As a result, these questions will not appear in the review screen.
You create a parameter named DataSourceExcel that holds the file name and location of a Microsoft Excel data source.
You need to update the query to reference the parameter instead of multiple hard-coded copies of the location within each query definition.
Solution: You add a Power Apps custom visual to the report.
Does this meet the goal?
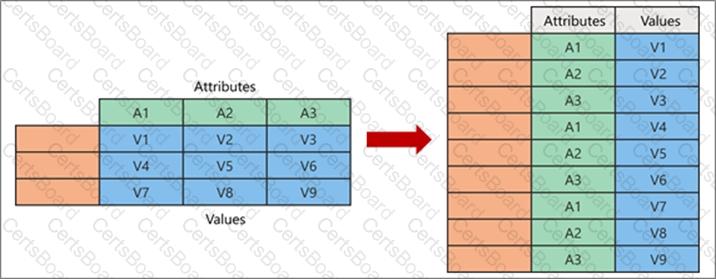
You have a query that returns the data shown in the following exhibit.
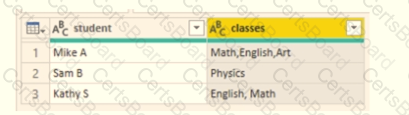
You need to configure the query to display the data as shown in the following exhibit.

Which step should you use in the query?
You have two tables named Customers and Invoice in a Power BI model. The Customers table contains the following fields:
CustomerID
Customer City
Customer State
Customer Name
Customer Address 1
Customer Address 2
Customer Postal Code
The Invoice table contains the following fields:
Order ID
Invoice ID
Invoice Date
Customer ID
Total Amount
Total Item Count
The Customers table is related to the Invoice table through the Customer ID columns. A customer can have many invoices within one month.
The Power BI model must provide the following information:
The number of customers invoiced in each state last month
The average invoice amount per customer in each postal code
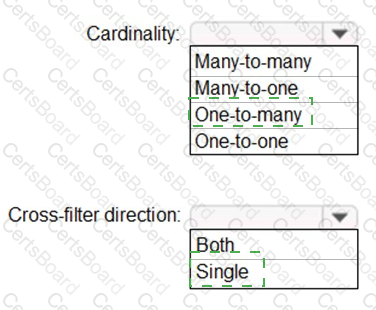
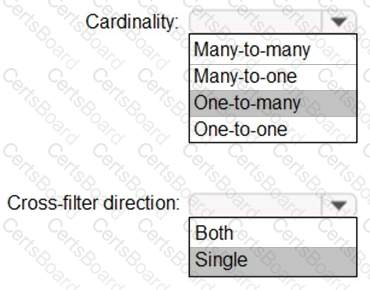
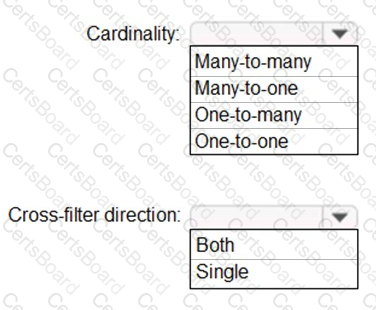
You need to define the relationship from the Customers table to the Invoice table. The solution must optimize query performance.
What should you configure? To answer, select the appropriate options in the answer area.
NOTE: Each correct selection is worth one point.
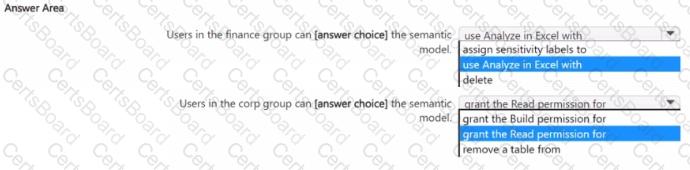
You have a semantic model that has the permissions shown in the following exhibit.
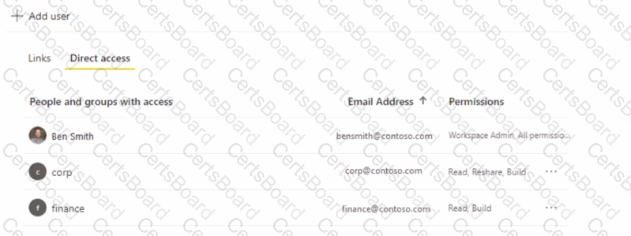
Use the drop-down menus to select the answer choice the that completes each statement based on the information presented in the graphic.
NOTE: Each correct selection is worth one point.
You build a Power Bl report that displays 10T temperature data streaming from a refrigerator.
You publish the report to the Bl service.
You need to be notified when the temperature rises above four degrees Celsius.
What should you do?


TESTED 01 Apr 2025