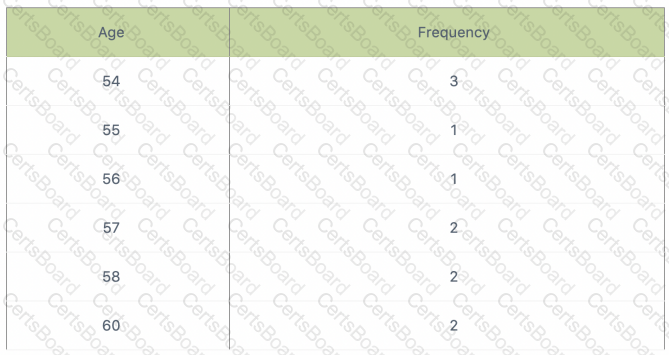
Consider this dataset showing the retirement age of 11 people, in whole years:
54, 54, 54, 55, 56, 57, 57, 58, 58, 60, 60
This tables show a simple frequency distribution of the retirement age data.

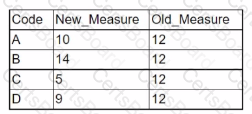
Given the following table:

Which of the following methods is the best way to describe the changes in the values in the table?
Which of the following data manipulation techniques is an example of a logical function?
Which of the following best describes a business analytics tool with interactive visualization and business capabilities and an interface that is simple enough for end users to create their own reports and dashboards?
Python


