Using the Time Series table, create a cross-tab showing sales for each Assortment broken down by Year and Quarter. In Q4 of October 2017, what was the Average sales amount for the Hardware assortment?
Which of the following are correct ways to define a join in Tableau version 2020.3 and above?
When exporting a worksheet as an image in Tableau, which of the following file formats are available?
Which of the following are valid ways to show Mark Labels in the visualisation?
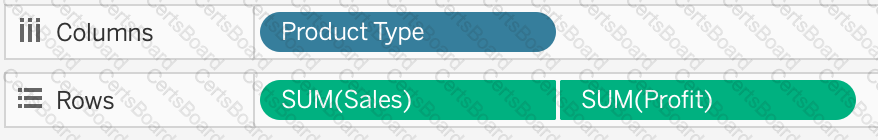
You have a bar chart that has a dimension on the Columns shelf and a measure on the Rows shelf.
How can you make a stacked bar chart?
Using the CoffeeChain table, create a Dual Axis chart showing the Sales (Bar chart) and Profit (Line Chart) for each Product type. What was the Profit for the Herbal Tea product type in 2013?
Suppose I have the following view. What will be the total number of marks if I drag a new measure to the row shelf vs the column shelf?
Download the Dataset from: https://drive.google.com/file/d/12AYHfiPWkwBmvH0zbumOURgUX6Az00Rw/view?usp=sharing
Using the Time Series Table, create a line chart to show Sales over time. Which Month and Year witnessed the lowest Sales?

TESTED 02 Apr 2025