You need to create a chart of type Indicator: Numeric Point that displays the following output:
count of employees with the gender male divided by the count of employee with the gender female.
The chart can then be filtered for different departments. What calculation is required to create the metric?
Which tool can you use to upload a report from the test instance to the production instance? Note: There are 2 correct answers to this question.
A user reports they are unable to successfully create a new Story report in Report Center. The page is stuck in a blank loading screen. How do you validate the user exists and has the proper configuration in the SAP Analytics Cloud Solution?
An executive reviews a canvas report on employee compensation. The executive discovers that NOT all employees are included in the report. You need to adjust the report so that all employees are included by default, but included employees can be adjusted at runtime. How do you accomplish this task? Note: There are 2 correct answers to this question.
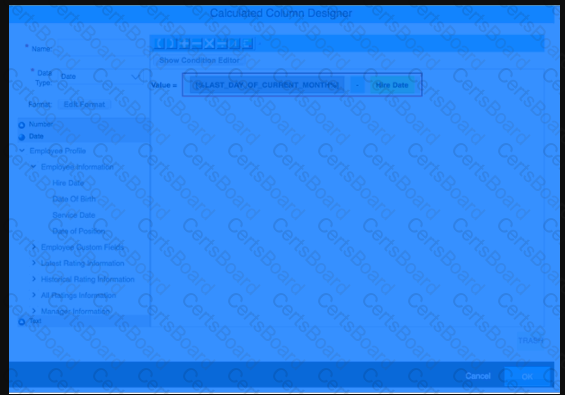
When constructing an expression for a calculated column in Query Designer, which syntax should you use to enter a date?
In Detailed Reporting, which fields can you format using Column Formatting on the Edit menu? Note: There are 2 correct answers to this question.
Which actions can you perform in a Simple Text component? Note: There are 3 correct answers to this question.


TESTED 04 Apr 2025