A business analyst creates a document with two sheets, Sheetl and Sheet2 The analyst needs to add a button on Sheetl. which will open Sheet2 and lock atl fields.
How should the analyst create this trigger?
Refer to the exhibit.

The straight table does NOT show all rows from the Field1 list box What does this indicate about the dataset?
Refer to the exhibit.
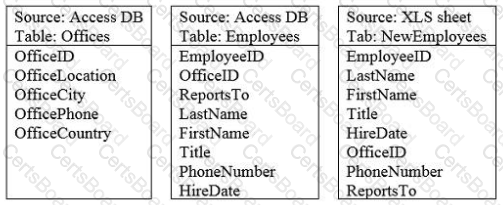
A data architect loads the three data sources without adjusting the load script. What is the result?
Refer to the exhibit.

The dataset shown has been loaded into a QhkView application The user has selected the year 7015' to analyze
This expression is used to calculate a value:
Num((Sum({!<[Month] = {'May'} >> SalesAmt-COGS)/Sum({1<[Month] = {'May*} >} SalesAmt)), ■#,##0.0**)
What is the result?
What is the result?
A business analyst has a ProductCode field that contains the value 'AB1980T60'. Which is the correct expression to extract all the numbers from this string?
A business analyst has data for these fields
• Year
• Sales Amount
• Product Number
• Country
• Order Number
Which three KPIs may be calculated? (Select three.)
A business analyst needs to visualize the sales of products by product category, product sub-category, and product name. The analyst would like to see the relative sales by product hierarchy without using a drill-down dimension.
Which chart type should the analyst use?


TESTED 28 Jun 2026