Refer to the exhibit.
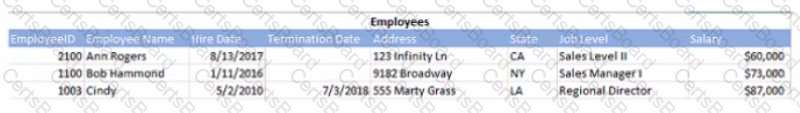
The data architect toads these fields from a data source A business analyst is creating an app for the human resources team Several visualizations are required
• Line chart to show the number of new hires and terminations monthly
• Treemap to show the number of employees by department and job level
• Distribution plot of annual salaries or amount of benefits received by duration of employment or location
• KPI to show average cost per employee
The cost per employee can be calculated by adding the employee salary to the amount of benefits received
Which two additional fields does the business analyst need from the data architect lo meet these requirements? (Select two )
A business analyst needs to develop a visualization that compares performances of every product the company sells and each product category. The CEO wants to highlight the worst- and best-performing products and categories in a meeting that beg/is in one hour Using a bar chart which two approaches should the business analyst use? (Select two.)
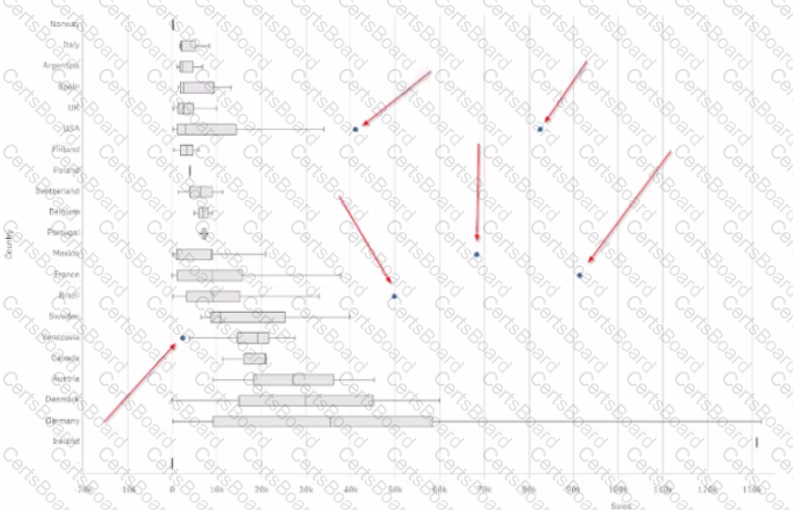
Refer to the exhibit
A business analyst is modifying a box plot End users report unexpected blue dots in a box plot
What should the business analyst do?
A business analyst is developing an app that contains a data model with fields Country. City. Sales ProductName and ProductCategory.The global sales manager wants to add new visualizations to this app
The business analyst must include the following
• Ability to dynamically change the number of countries and cities
• Display a maximum of 10 countries
• Display a maximum of 5 cities per country
Which steps should the business analyst take?
A business analyst needs to uniquely identify tour sheets in the app overview Custom images have been created for each sheet What should the business analyst do next?
A business analyst wants to send an email to app users when the region's sales exceed $50,000. The notification must be delivered through a mobile app What should the business analyst configure?
A business analyst creates an app for a large retailer The app is based on me past ^2 months of transactional data in CSV formal
After successfully demonstrating the app the retailer provides a tile that contains another seven years of data
After the new datais loaded the previously responsive app takes 10 times longer to respond to users' selections The app has many complex expressions
Which two actions should the business analyst take to resolve the issues?(Select two)


TESTED 09 Apr 2026